Lab
3 Part 2: Graphics and user input
At
the moment, your random-evolver for lists displays its interim generations
using text only. This part will uses Python's graphics to display those lists.
In addition, we will use graphics-based input in order to interact with the
functions.
Displaying
the lists graphically
The csplot.py module contains a function
named show that will display lists as
patches of color in a window. To use csplot, follow these steps:
- Be sure that
you download csplot.py to the same directory
that your
hw3pr1.pyfile is located.
This is the link to csplot.py. Use right-click on a PC or control-click on a Mac
You should re-download the file from the link above - it has changed since the last HW. - Include the line from csplot import * at the top of
your hw3pr1.py file near the
other import lines - this will provide access to the graphics functions in
csplot.
- Include the
line show(L) right above
the print(L) line that is
already in your runGenerations function. This
is the command to display your list graphically.
How does it display lists?
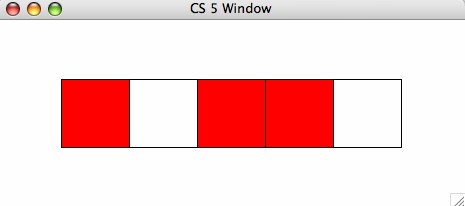
Try
the function call
show( [1,0,1,1,0] )
and you should see a window that looks like the
following:
NOTE: csplot has
the same "frozen window" problem as turtle graphics had. After csplot finishes each command its window will
become unresponsive. This is OK; as soon as you give it another command it will
update to show this command. However, if you want to see the result of your
previous command (and end your interaction with the csplot window) you can type done() at the python prompt and the csplot window will respond again. However, after
typing done(), you will have to close the csplot window before you can interact with the
python shell again. For most of the assignment, you will not need to use the done() command. When we add mouse
input, the window will respond just fine.
Try
it out
Alter your runGenerations code by adding the line show(L) above the line print(L) that is already there. Try it out with runGenerations( [0,0,0,0,0] ) or variants... .
Want different colors?
You can set each value's color at the Python prompt, as
follows:
>>> setColor( 0, "purple" )
>>> setColor( 1, "blue" )
>>> setColor( 2, "green" )
>>> show( [0,1,2,0,1] )
resulting in the image
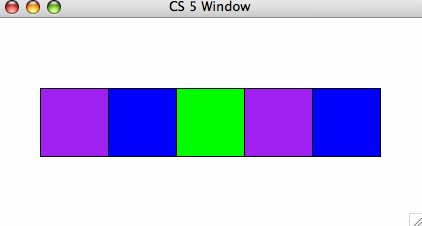
We
will be using only 0s and 1s, but this example
shows that other values are also possible.
The approach to evolving lists thus far is, well, a bit
too random. This section will enable the user to guide the process by clicking
on the graphical representation of the list.
Getting mouse input
Replace
your evolve and setNewElement functions by copying these at the bottom of
your file:
def evolve( L ):
""" evolve takes in a list of
integers, L,
and returns a new list of integers
considered to be the "next
generation"
"""
N = len(L)
# N now holds the size of the list L
x = sqinput()
# Get mouse input from the user
return [ setNewElement( L, i, x ) for i in
range(N) ]
def setNewElement( L, i, x=0 ):
""" setNewElement returns the
NEW list's ith element
input L: any list of integers
input i: the index of the new element to
return
input x: an extra, optional input for future
use
"""
if i == x: #
if it's the user's chosen column,
return choice( [0,1] ) # return a random 0 or 1
else: #
otherwise
return L[i] # return the original
Note that sqinput() is a function from the csplot module which takes mouse input from the
user. It returns the index of the square closest to the mouse click.
Try running runGenerations(
[0,0,0,0,0,0] ). Now,
the execution should pause and wait for you to click on one of the squares in
the window. Note that the square does not simply change from 0 to 1 and 1 to 0 -
the call to choice randomizes the result.
Change the setNewElement function
so that the light the user clicks on toggles from 0 to 1 or from 1 to
0, as appropriate. Hint:
if the old value of the light is L[i], what will you get if you
subtract that value from 1?
Be
sure to test your code by running
runGenerations( [0,0,0,0,0,0] )
Admittedly, the "game" is not difficult to
win in this case, but the next part of the lab adds the wrinkle that makes it
much more challenging.