Plotting
functions using csplot.py
There
is a set of functions in the file csplot.py with which you can
create plots of data. You can download csplot.py to your computer by right-clicking (Windows) or
control-clicking (Mac) the link below and choosing to save the file:
Download
csplot.py from this link.
You
need to make sure that csplot.py and hw2pr1.py are placed in the
same directory.
In
your IDLE editing window, add the following line to your hw2pr1.py file:
from csplot import *
This
line above will make all of the functions in
csplot.py available to you in IDLE's shell after you press F5.
As
a first graphical plot, we will create a parabola. First, in your hw2pr1.py file, copy this squaring function:
def sq(x):
""" sq(x) squares its input
input: x, a numeric value
"""
return x**2
Save
your hw2pr1.py file and press F5
to load it into the Shell. At the Python prompt, try the following example
using your fsteps function:
>>> Y =
fsteps(sq,-2,2,128)
>>> Y
(you'll see the 128
values in the list Y)
>>>
plot(Y,-2,2)
You
should see a window with a happy parabola, e.g.,
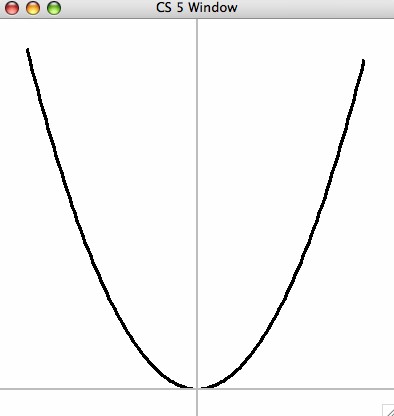
If
you don't see a window, it might be "hiding" behind the rest of your
windows, so look around for it.
You'll
notice that after the plot window opens, you can no longer type commands into
Python's shell. To gain control and enter more commands, you need to close the
window containing the plot. Go ahead and close this window now.
After
closing the window, return the Shell and try the following:
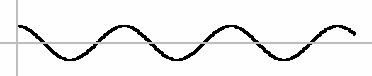
>>> Y = fsteps(math.cos, 0, 20, 200)
>>> plot(Y,0,20)
A
window should come up that looks somewhat pythonic:
Close
this window again to get control back to the shell.
For
a view of the rectangles that will contribute to the integral of the function,
try the following:
>>> Y = fsteps(math.cos, 0, 20, 200)
>>> plot(Y,0,20,'sprecL')
How
can I change the plot window?
Here
is a brief list of functions you can use.
1.
plot(Y,low,hi) plots line segments joining the data in the list Y evenly spaced from
low to hi (excluding hi). It is also
available as plotS(Y,low,hi).
2. plot(Y,low,hi,'p') plots
only the points in Y, not the line segments connecting them.
3.
plot(Y,low,hi,'recL') plots rectangles with their upper-Left-hand
vertices in Y.
For
convenience, you can concatenate the strings that are the optional fourth
parameter, with 's' representing the
default line-segment plot. Thus, plot(Y,low,hi,'sprecL') gives you the "spreckle" plot with lots of
goodies.
csplot
documentation contains
more detailed descriptions of the functions and fourth parameter options - you
will not need these, however!
Here
are some keyboard-and-mouse actions:
1.
shift-mousedrag zooms the canvas in/out as you go
toward/away from the center
2.
z-mousedrag zooms the canvas in centered on the
rectangle defined by the cursor
3.
x-mousedrag zooms only the horizontal axis
4.
y-mousedrag zooms only the vertical axis
5.
t-mousedrag translates or slides the canvas around
6. p-left click (clicking with the
'p' key pressed) prints the position of the mouse both in
terms of pixels on the screen and the plot
7.
ctrl-left click centers the canvas at the clicked position
8.
R resets the zoom and centers the view
9.
? displays csplot Help
Once
you understand how to use csplot, return to Lab2 and continue
working.